Net_Graph FAQ for Steam Games
last
edited 04/03/2012 06:18:30 PM
by qUiCkSiLvEr
The Net_Graph tool
that is built into the Half-Life Client is one of the best tools
to understand and tweak your performance and game settings.
It also is a wonderful tool to
help diagnose connection problems and distinguish
if they are Network related, Client related or Server related.
How to
enable, control and disable Net_Graph:
To turn
on
the netgraph, type
net_graph 1
(2
and
3
have additional data)
on
the console. To turn it off, type
net_graph 0 at the console.
The netgraph may be positioned
on the left, middle or right of the screen
by setting net_graphpos to 0, 1, or 2
as needed.
You can adjust the size of the netgraph by setting the net_graphwidth
CVAR.
How to read the net_graph
Area 1:
The Area 1 colors signify the following: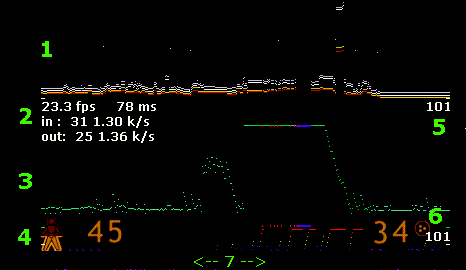
| red: | player specific data for you only |
| yellow: | other player data |
| purple: | other entity data |
| light blue: | event data |
| dark blue: | temporary entity data |
| green: | sound data |
| gray: | user defined message data |
| white dots at top: |
signifies packet size (only if net_graph is set to 2) |
Area 1 is the part above the white separating line.
This area gives you a rough
estimation of the size of each packet
your client is receiving from the server.
The scale defaults to 5 bytes of data
per pixel.
You can change the scale by setting the "net_scale"
CVAR to
something else.
Area 2:
This area shows numeric
information about the performance of your computer and its net connection.
The
numbers registered are as follows (based on the above snapshot):
As shown, the
client is rendering frames at 23.3 frames per second.
The client believes that it has a 78 millisecond round trip message time to the server (this is a latency reading, rather than a pure ping, since it includes processing overhead on both ends).
The last packet the client received ("in") from the server was 31 bytes long.
The average data rate over the last second or so from the server has been 1.30 kilobytes/second.
On the other hand, the last command issued by the client was only 25 bytes long and the client is generating 1.36 kilobytes/second of upstream data.
Area 3:
Below the numeric readout is
the well-understood green/red/yellow/blue Ping readout that most users are familiar
with.
In particular, the height of the green line indicates how much latency exists in the connection for the specific packet received.
The green lines max out at around 1000 ms of latency, so our player here has a baseline of about 78 ms of latency, but his connection is having problems so there is "Ping Excursion" with "capping" that goes all the way to the maximum value of 1000.
The red dots in the ping line indicate dropped packets (a little hard to see but they are there).
Finally, if the bandwidth choke is active (your rate setting is holding back packets at the server because your connection can't handle them), then the green dot for the next packet you receive will be drawn in yellow instead.
Area 4:
Area four is correlated to how
quickly the client is rendering frames.
For each frame rendered, the graph indicates how much interpolation was used in drawing objects in the world.
If you are not getting a sufficient number of server updates (< 10 second) or you drop enough packets, then the client won't be able to interpolate any more and will have to extrapolate instead.
In that case, you'll see the lower part of the graph go above the grayish line (above the dark blue area) and turn yellow to orange / red depending upon how far out of date your data becomes.
Area 5:
The number here is the number
of updates per second you are currently requesting from the server.
The default is to receive 20 updates/second from the server.
You can change this value by setting the cl_updaterate CVAR from the console.
Area 6:
This number is the maximum
number of command packets you will send to the server per second.
The default is to send up to 30 command packets per second up to the server.
If you are running faster than 30 frames per second, then multiple commands will be put into some packets.
You can change the rate of sending command packets to the server by setting the cl_cmdrate CVAR.
In addition, with each command, we re-send the last few previous movement commands (in case there is packet loss) so that we can keep moving smoothly in the face of minor network problems.
The default number of "backup" commands that we send is 2, but you can change this number by setting cl_cmdbackup to another number.
You can send more than 8 backup commands, but you should note that sending backup commands will increase your outgoing bandwidth usage.
Area 7:
The final area is the
light blue and (sometimes) red line at the very bottom of the netgraph.
This line is based on your framerate (FPS) and your cl_cmdrate setting.
For every frame where a command packet is actually send out onto the wire, a light blue dot is placed on the graph.
If commands are accumulated for deferred sending, you'll see a red dot instead, in other words the red dots appear when your client is rendering frames (FPS) faster then you are sending updates to the server.
This could be
because you have the cl_cmdrate
set too low.
Try setting cl_cmdrate
to half your framerate (FPS) to see the effect.
FPS = 60,
cl_cmdrate = 30 --> red dots (unable to send requested updates)
FPS = 60, cl_cmdrate = 60 --> no red dots (sending exact updates - best
for accuracy)
FPS = 30, cl_cmdrate = 60 --> no red dots (sending extra duplicate
updates - wastes uplink bandwidth)
Put very simply, the red dots mean your client isn't updating the server often enough.
This will change from time to time though depending on the map and events, so setting a reasonable cl_cmdrate that doesn't overload your uplink and leaving it is best.
Below are are
several screenshots that should help to show good and bad Net_Graph displays.
These pictures are contrast enhanced somewhat to bring out the Net_Graph pixels.
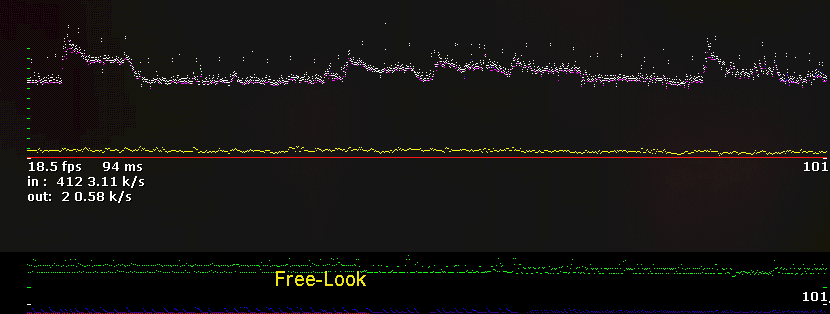
This is a good
net_graph, (it's slow 18fps because it's doing 640 samples).
See the red dots on the left bottom side - the cl_cmdrate was set there to
"10".
The green ping line looks bi-modal (seems to be two different levels of ping) because the server was severely updaterate limiting the client. What you are seeing is the walk in the synchronization between the client requesting an update and the server either delivering the update immediately (the lower ping) or waiting to complete the current frame and then sending it (the higher ping). In this case, the server was limiting updaterate to "13" which results in an periodic ping excursion (a walking beat) of about 7.7ms.
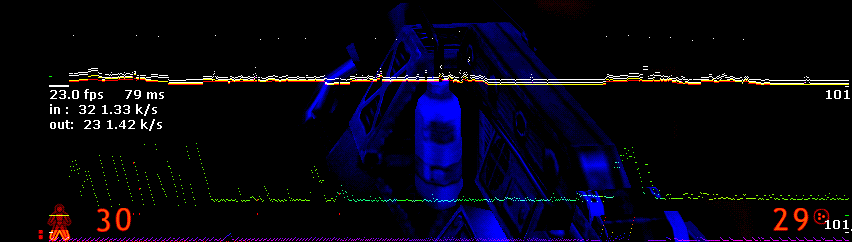
The next
picture below is a pretty bad net_graph.
Notice the green ping line and how it peaks ... this is "Ping
Excursion"
The bottom blue line has a few excursions too, this is Render Excursion.
In Render Excursion, The client system is guessing what to render instead of
having valid data to render from.
Little bumps like these are usually caused by other processes running on the server stealing away time from the game server, and is much more pronounced if the server isn't running at HIGH Priority.
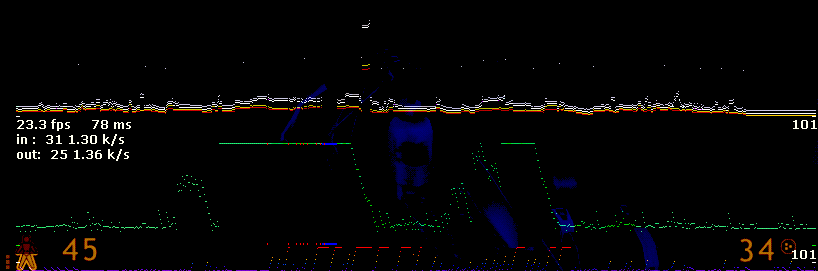
This final
picture below is real bad net_graph.
See how the green ping line climbs and then peaks. When it goes flat at
the top, that is called "capping".
The red Render excursions are real pronounced on this graph and they are showing capping as well.
Considerations for tweaking your network settings
First, the client and server framerates are now decoupled, so there is no need to use a low fps_lan or fps_modem setting. I.e., running your client at a high fps won't flood out your connection if you are on a modem.
Second, the rate command is now a bit more accurate than it was before. As always, it is critical to set your rate appropriate to your connection quality.
Finally, the engine now does a pretty good job of spacing out packets sent back to you to try and minimize the latency involved.
Instead of skipping an update period completely (i.e., if you are getting 20 updates a second, then instead of waiting 0.05 seconds) if your connection rate won't allow sending another packet, we check for clearing of the data in the pipe much more often than that interval and send as soon as we can (limited by the server's sys_ticrate).
In essence, we expand the time between updates to use your specified bandwidth without introducing unneeded latency.
Additional information:
What is choke?
http://www.mail-archive.com/hlds_linux@list.valvesoftware.com/msg01597.html
I can't help much here but I have something that Yahn Bernier once said. "choke occurs when the server, factoring in your rate setting, determines that it can't send you an update yet because doing so would start to flood your connection.
The server checks back every frame until you are ready to receive an update and sends the next update as soon as possible.
The time when you get the next packet is computed right after
the previous packet is sent:
next packet time = current time + ( bytes in packet + UDP header overhead ) /
rate setting ( bytes per second )
In addition, the server won't even check the packet choke timer unless you have waited at least 1 / cl_updaterate seconds since the last update (i.e., if you are getting 20 updates a second, packets will be spaced at least 50 ms apart and also subject to the packet choke timer).
On a slow connection (modem), in a busy game, you'll probably see a lot of choked packets.
Note that once the choke as held back a packet, you don't wait until the next 50 msec multiple, for the above example, but instead get the next update as soon as the choke timer has cleared.
Yahn"
Got it?